.png)

PFMEA (Process Failure Mode and Effects Analysis) is a structured method for identifying where a manufacturing or assembly process can fail, evaluating the effects of each failure on the product and downstream operations, and prioritizing corrective actions before the process runs at scale. Each potential failure mode is scored for severity, occurrence, and detection, so engineering effort goes to the risks that matter most.
Where a design FMEA asks "how can the product fail?", a process FMEA asks "how can the way we make the product fail?" — a misloaded part, a missed torque spec, a vision system that passes a defect. PFMEA turns those what-ifs into a ranked, documented risk register that drives real process controls.
PFMEA originated in the automotive and aerospace industries and is now standard practice anywhere process escapes are expensive: medical device manufacturing, consumer electronics, industrial automation, and high-volume assembly. It is a core expectation of quality frameworks including IATF 16949, ISO 13485, and the AIAG-VDA FMEA Handbook.
IMAGE (A completed PFMEA worksheet excerpt showing columns for process step, failure mode, effects, severity, occurrence, detection, and action priority — annotated callouts highlighting one fully worked row)
FMEA (Failure Mode and Effects Analysis) is the parent methodology. PFMEA and DFMEA are its two most common applications, and the difference is scope:
The two are sequential, not competing. A well-run DFMEA hands its findings to the PFMEA team: a design characteristic flagged as high-severity becomes a process characteristic that needs tighter control. If your DFMEA says a seal surface finish is critical to waterproofing, your PFMEA had better examine every process step that can scratch it.
A note on terminology: "process FMEA" and "PFMEA" are the same thing, and you'll see both in standards documents. When someone says just "FMEA" in a manufacturing context, they usually mean the process variant.
The honest answer most guides skip: earlier than feels natural. The highest-leverage window is during process design — when the line layout, station sequence, and automation concepts are still changeable. A PFMEA performed after equipment is installed can only bolt on inspection; a PFMEA performed during process development can eliminate the failure mode entirely.
In practice, trigger a PFMEA (new or revised) when:
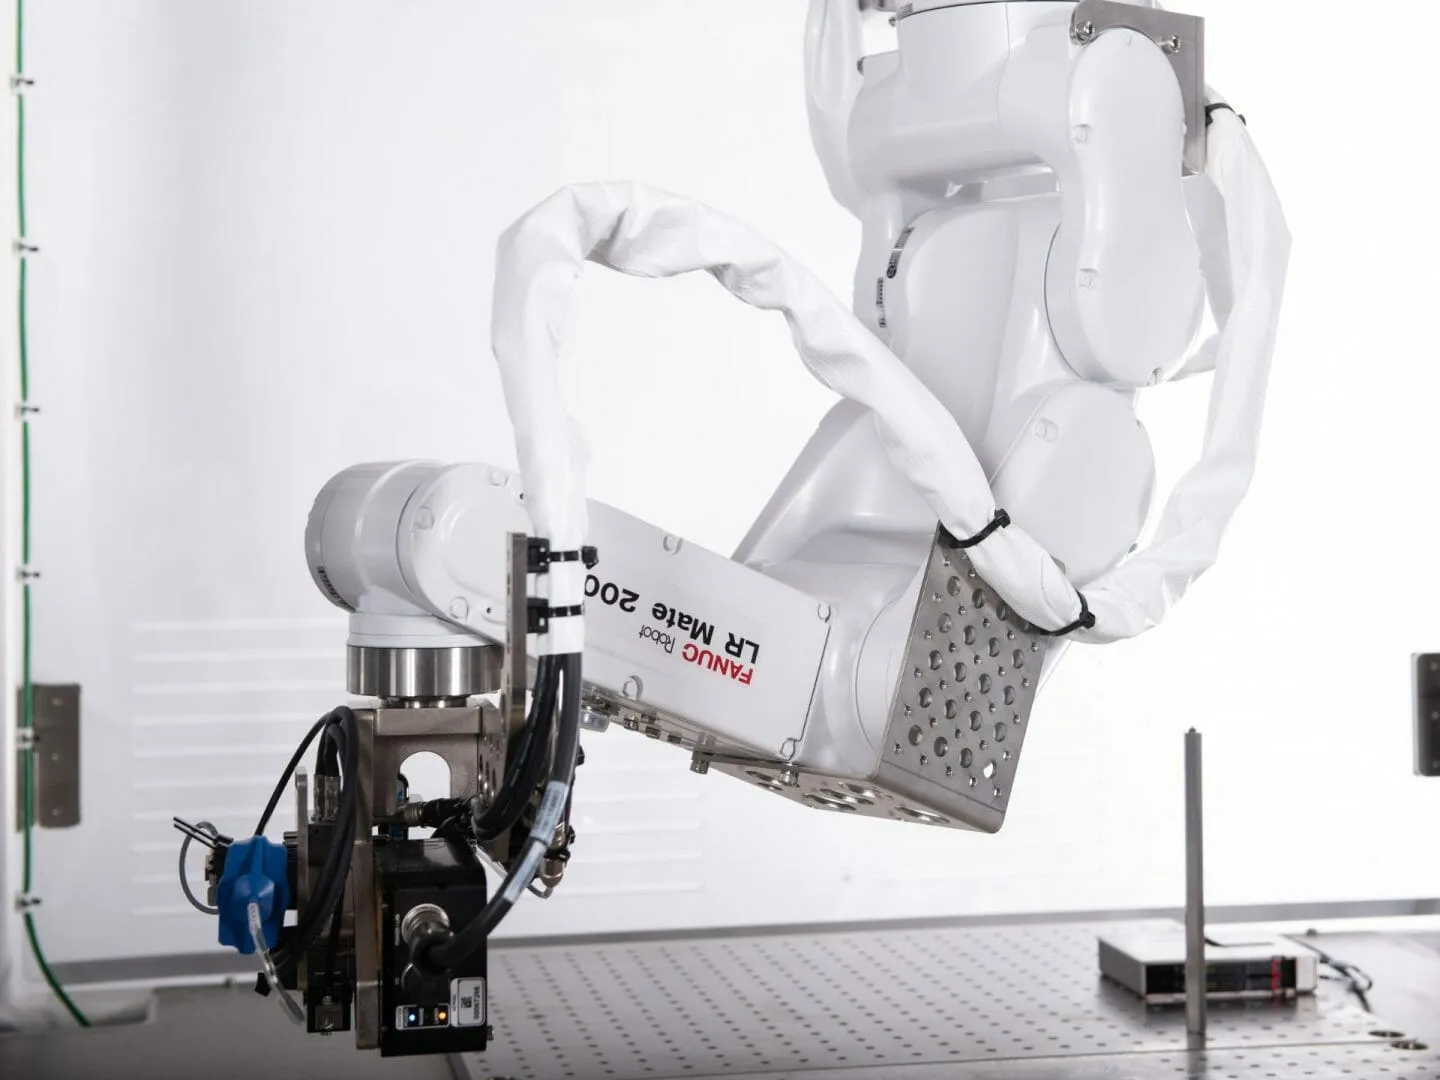
For automated lines, the PFMEA should mature alongside the automation concept itself. When we develop custom automation at Andrews Cooper, failure mode analysis runs in parallel with station design — because the cheapest error-proofing is the one designed into the end-of-arm tooling, not inspected in afterward.
The current AIAG-VDA FMEA Handbook defines a seven-step approach that has replaced the older five-phase format in most automotive and regulated supply chains:
IMAGE (A horizontal 7-step process flow diagram of the AIAG-VDA PFMEA method, styled to match the Andrews Cooper Tech Talks visual language, with a short label under each step)
Every failure chain gets three ratings on 1–10 scales:
The classic method multiplies the three scores into a Risk Priority Number (RPN = S × O × D), ranging 1–1,000, and works the list from the top down. RPN is simple but has a known flaw: it treats a 9-2-2 (RPN 36) the same as a 2-2-9, even though a severity-9 failure with moderate occurrence deserves far more attention than a nuisance defect that's hard to detect.
The AIAG-VDA handbook replaced RPN with Action Priority (AP), a lookup table that assigns High / Medium / Low priority from the S-O-D combination, weighting severity first, then occurrence, then detection. High-AP items require action or documented justification; Medium-AP items should get action where practical.
Which should you use? If you supply automotive customers under IATF 16949, use AP — it's what auditors expect. Outside that supply chain, RPN remains common and workable, provided you add a severity rule (for example: any S ≥ 8 gets reviewed regardless of RPN). Many teams run both during the transition.
Here's a condensed, realistic example from the kind of automated assembly work we engineer — a servo press station seating a bearing into a housing:
Two things make this row work, and they generalize to every PFMEA you'll write. First, the function is quantified, which makes the failure mode objectively definable. Second, the optimization acted on the cause (part seating) rather than adding downstream inspection — the force-curve monitoring was already a strong detection control, so the leverage was in prevention.
A full PFMEA for a station like this would carry 15–30 failure chains: wrong bearing variant loaded, raceway contamination, press ram wear, force transducer drift, and so on. The worksheet grows fast, which is exactly why the prioritization discipline matters.
IMAGE (Photo or render of an automated servo press station with a robotic loader — ideally from an Andrews Cooper automation project — showing the nest fixture and press head, with the monitored force curve inset)
Whatever software or spreadsheet you use, a working PFMEA template carries these columns:
Resist the urge to add columns before you've completed a full pass — teams that customize the template first tend to stall in formatting instead of analysis.
A practice worth knowing that most PFMEA guides omit: reverse PFMEA (sometimes "reverse FMEA" or R-FMEA) takes the completed worksheet to the production floor and tries to physically create each failure mode at the station. Can the operator actually load the part backwards? Does the sensor really catch the missing washer? Each attempt either confirms the documented control or exposes a gap — and floor operators routinely surface failure modes the engineering team never listed.
Reverse PFMEA works best as a standing audit rhythm after ramp (quarterly, or after any process change), turning the PFMEA from a launch document into a living control system. It's also one of the fastest ways to rebuild a stale PFMEA you've inherited: verify it against the physical line before you extend it.
Treating it as paperwork. A PFMEA written by one engineer the week before an audit satisfies a checkbox and protects nothing. The analysis needs the people who know how the process actually misbehaves: process engineers, operators, maintenance, quality.
Vague failure modes. "Part defective" isn't analyzable. "Bearing cocked >0.5° during press" is. Precision in the failure mode column is what makes the rest of the row honest.
Inspecting instead of preventing. Detection controls reduce escapes; prevention controls reduce failures. If your optimization actions are all new inspections, revisit the causes — fixturing, error-proofing, and parameter interlocks are almost always the better investment.
Ignoring the DFMEA handoff. High-severity design characteristics must flow into the process analysis. If the PFMEA team never saw the DFMEA, severity scores end up guessed — usually low.
Letting it die after launch. Every engineering change, supplier change, and quality escape is a PFMEA update trigger. A worksheet last touched at SOP two years ago is a historical artifact, not a risk tool.
What does PFMEA stand for?
PFMEA stands for Process Failure Mode and Effects Analysis — a structured risk-analysis method that identifies how a manufacturing or assembly process can fail, evaluates the consequences, and prioritizes preventive and detective controls.
What are the 7 steps of PFMEA?
Under the AIAG-VDA handbook, the seven steps are: (1) planning and preparation, (2) structure analysis, (3) function analysis, (4) failure analysis, (5) risk analysis, (6) optimization, and (7) results documentation.
What is the difference between PFMEA and FMEA?
FMEA is the general methodology; PFMEA is its application to manufacturing and assembly processes. The other major variant, DFMEA, applies the same method to product design. In a manufacturing context, "FMEA" usually refers to the process version.
What is a good RPN score in PFMEA?
There is no universal threshold — RPN values are only comparable within one analysis, because scoring anchors differ between teams. Rather than a fixed cutoff, prioritize the highest RPNs, mandate review of any item with severity ≥ 8, or use the AIAG-VDA Action Priority table, which handles this weighting for you.
Is PFMEA a Six Sigma tool?
PFMEA predates Six Sigma — it grew out of aerospace and automotive reliability practice — but it is widely used within Six Sigma programs, typically in the Analyze and Improve phases of DMAIC, and within lean manufacturing and APQP frameworks.
How often should a PFMEA be updated?
Whenever the process changes: new equipment, materials, suppliers, layouts, or duty cycles — and whenever a quality escape or field failure traces back to manufacturing. Many teams also run a standing reverse-PFMEA audit quarterly to keep the document aligned with the physical line.
Andrews Cooper engineers custom automation, robotics, and high-volume manufacturing processes where failure is expensive. If you're developing a line where process risk needs engineering out — not just inspecting out — talk to our automation team.